Quick Charting in FileMaker 12

We’ve done a few posts in the past on the charting functionality in FileMaker Pro, but one of the new features that they’ve added in FileMaker 12 that’s kind of cool is Quick Charting. Quick charts are basically an easy way to quickly generate charts on the fly without creating a separate layout.
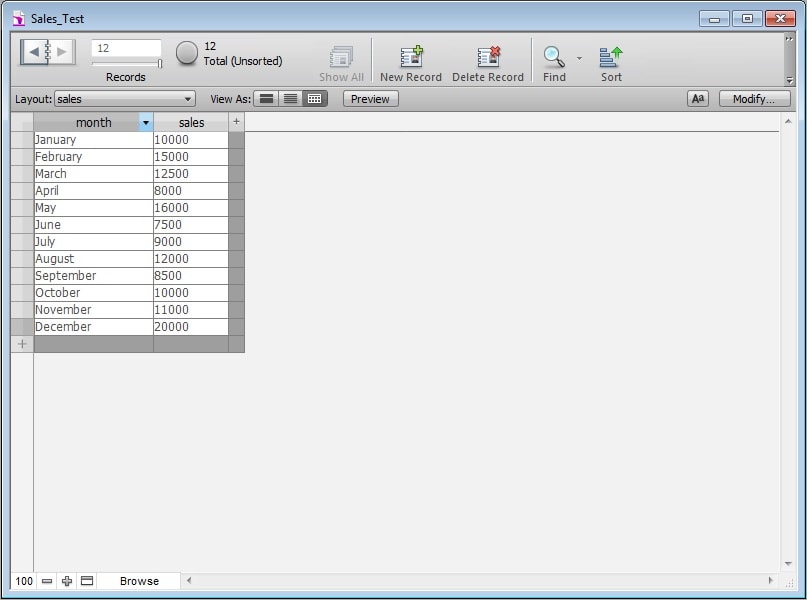
To do this, you’ll need to be in browse mode, and switch to Table view. As an example, I’ll start with a simple database of sales for January to December:

I’ll create a chart of sales by month. To start with, we’ll need to sort by Month; to do this right click on the month column header and sort by Month. I created a value list called month containing hte values January through December, so I chose to sort by the value list Month.
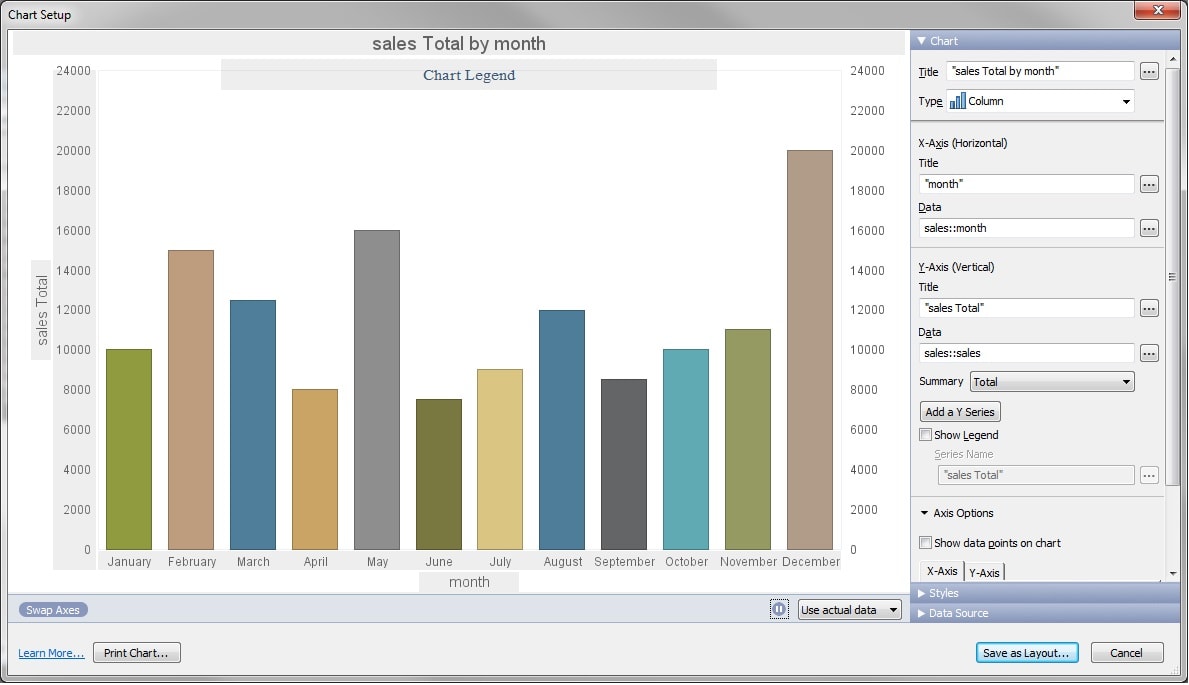
Next we’ll create the actual chart. Right click on the Sales column header select Charts. There should be two options – Chart by sales and Chart sales by month. Choose the second option, and it pops up the charting interface:

If you’ve done any charting in FileMaker at all, this will look familiar; it’s the full Charting interface. You can change the chart type to any of FileMaker’s available chart types, change the labels, add a legend, change the formatting, etc. There are a couple of new options as well – for example, in the bottom right there is a button to create a new layout with this chart.
Overall; it’s a neat new feature, especially if you need a quick chart on the fly, or you want to play around with the format of the chart before creating a dedicated layout for the chart.


Comments